
Toronto, Ontario
Toronto house prices
TRREB's latest City of Toronto figures: a $770,000 median and a $979,684 average across 1,767 sales in August 2026, broken down by property type and by community.
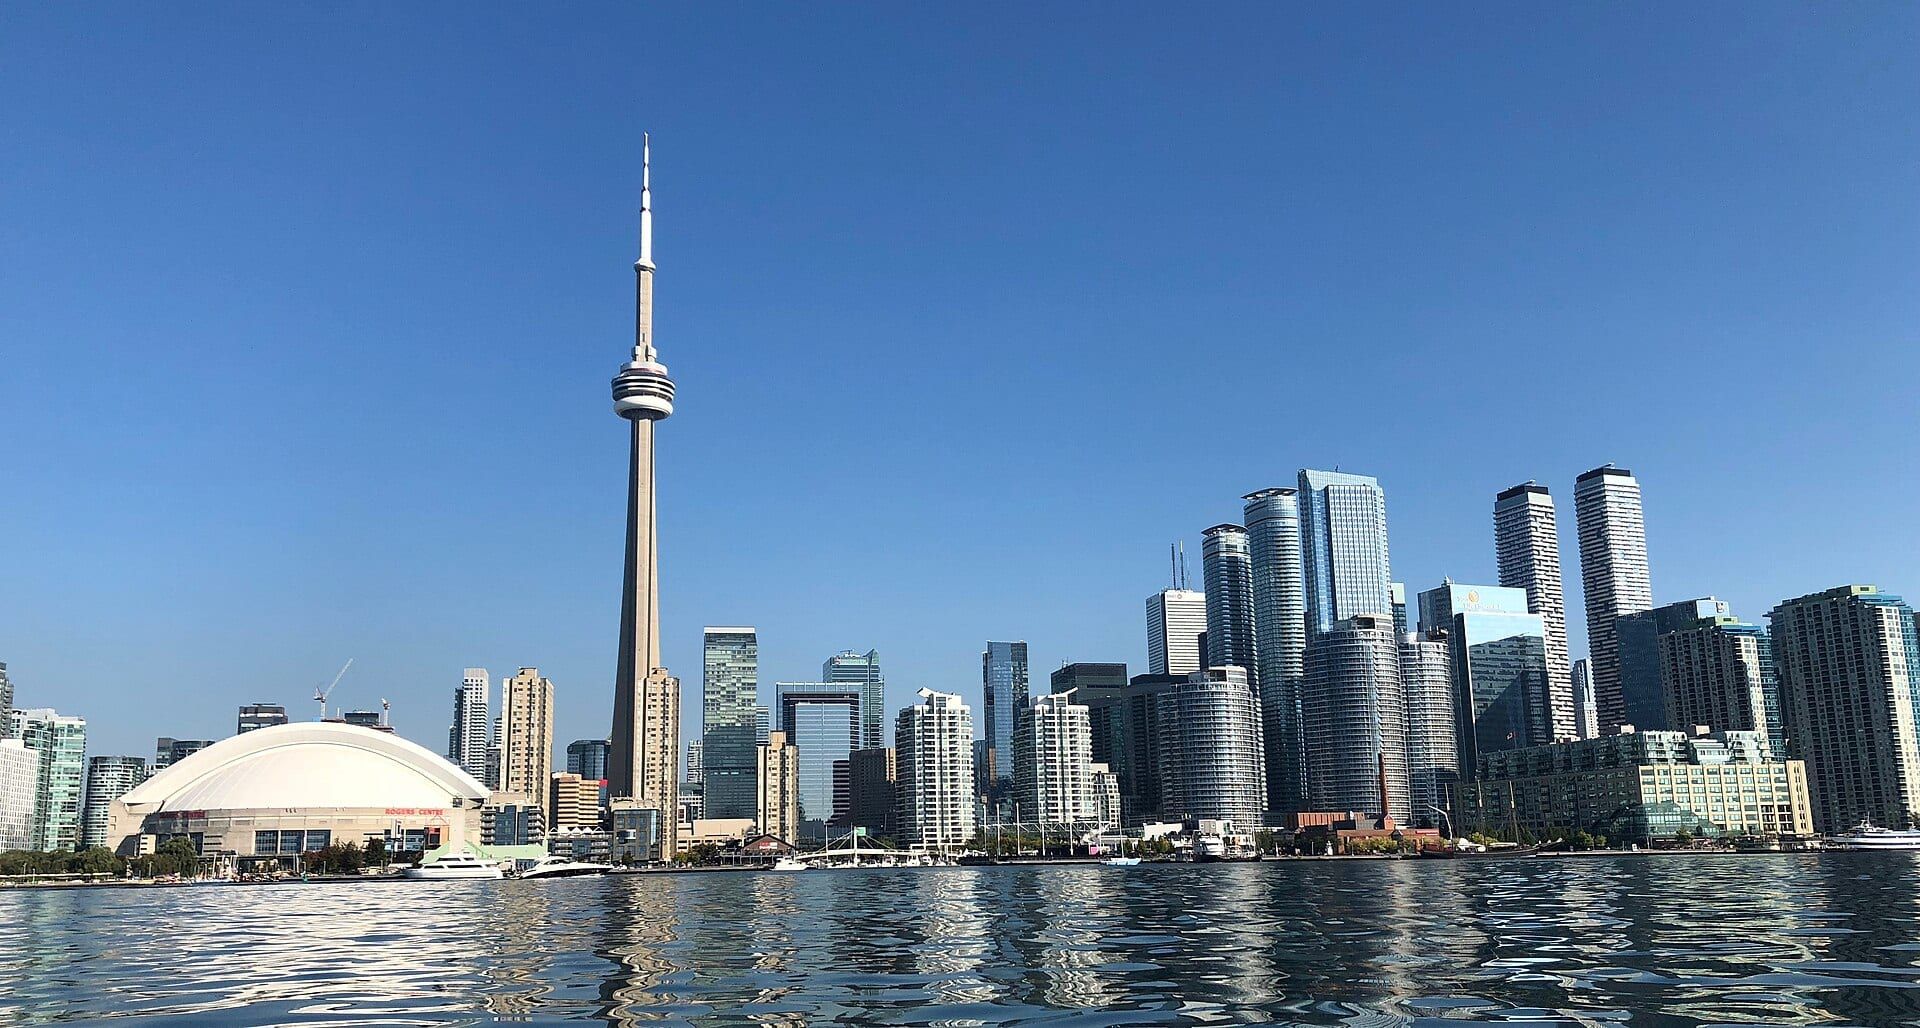
Toronto prices by property type, August 2026
| Property type | Sales | Average | Median |
|---|---|---|---|
| Detached | 550 | $1,525,749 | $1,170,000 |
| Semi-detached | 159 | $1,110,639 | $981,000 |
| Freehold townhouse | 45 | $1,026,018 | $962,000 |
| Condo townhouse | 120 | $712,296 | $661,650 |
| Condo apartment | 885 | $651,648 | $550,000 |
| All property types | 1,767 | $979,684 | $770,000 |
Read the row that matches the home you own or want. About 50% of the month's sales in the City of Toronto were condo apartments, so the all types median describes condos far more than houses. In August 2026 the detached median was 2.1 times the condo apartment median. The August 2026 Toronto market report covers the whole month, including new listings and days on market.
Prices in the communities we cover
TRREB publishes quarterly figures for each of its Toronto communities. These are the all property types medians for Q2 2026 in the communities behind our twelve neighbourhood guides. Where a guide spans two TRREB communities, both are listed under TRREB's own names.
| TRREB community | Median, all property types |
|---|---|
| Leaside | $1,850,000 |
| Lawrence Park South | $2,550,000 |
| Lawrence Park North | $1,922,500 |
| Annex | $1,240,000 |
| Bayview Village | $622,500 |
| High Park-Swansea | $1,175,000 |
| High Park North | $1,345,500 |
| The Beaches | $1,600,000 |
| North Riverdale | $1,799,000 |
| South Riverdale | $1,257,500 |
| Willowdale East | $630,000 |
| Willowdale West | $764,000 |
| Banbury-Don Mills | $853,000 |
| Yonge-Eglinton | $1,450,000 |
| Mount Pleasant West | $630,000 |
| Islington-City Centre West | $594,500 |
| Waterfront Communities C1 | $610,000 |
| Waterfront Communities C8 | $597,500 |
A low median is often a sign that condo apartments dominated the sales rather than a sign of cheap houses. Each neighbourhood guide splits its community figures by property type.
Toronto next to Markham, Mississauga and Vaughan
| City, August 2026 | Sales | Median | Average |
|---|---|---|---|
| City of Toronto | 1,767 | $770,000 | $979,684 |
| Markham | 282 | $1,095,000 | $1,208,692 |
| Mississauga | 435 | $842,000 | $898,510 |
| Vaughan | 242 | $1,148,750 | $1,234,758 |
Toronto's lower headline median against its neighbours comes from the same condo effect. Each comparison page sets detached against detached and condo against condo.
Median and average are different questions
The median is the sale in the middle of the list, with half above it and half below. The average adds every price and divides by the number of sales, so a small number of very expensive homes lifts it. In Toronto, where a few sales each month run into many millions, the average usually sits well above the median. For planning, the median for one property type is the steadier guide. Neither figure values a particular home.
Using these numbers
- Selling: a free home valuation starts from the comparable sales around your street. With a free account you can also look up Toronto sold prices yourself.
- Downsizing: compare Toronto neighbourhoods for downsizing by what the smaller homes there cost.
- Buying: put the price you have in mind through the mortgage calculator and the land transfer tax calculator, which adds Toronto's municipal tax.
Sources
- TRREB Market Watch, August 2026
- TRREB Community Housing Market Report, Toronto Central, Q2 2026
- TRREB Community Housing Market Report, Toronto East, Q2 2026
- TRREB Community Housing Market Report, Toronto West, Q2 2026
General information from TRREB for the periods stated. It is not an appraisal or an opinion of the value of any property.